January 7, 2021
A temporary 4.3% surcharge reduced nonprofit mail.
How much will 5.6% to 7.6% annual permanent rate increases add to the spiral?
Nonprofit mailers have been hit with three major events in the past dozen or so year that have forced them to greatly reduce their use of USPS Marketing Mail and Periodicals Mail:
- the great recession
- the temporary 4.3 percent exigent surcharge, and
- the pandemic.
We do not know how the significant nonprofit use of First-Class Mail has been affected because the Postal Service does not measure it. Many nonprofits use single-piece FCM for return donations, memberships, and subscriptions, and some use it for outbound letters to donor and members.
The USPS recently recognized Alliance founding board member ALSAC/St. Jude Children’s Research Hospital with the following citation for a 2020 Mailing and Digital Innovation Award:
Despite being a non-profit organization, ALSAC purchased 12+ million Forever Stamps to deliver First-Class direct mail pieces to their most valued benefactors. ALSAC included a certificate of appreciation, a letter of thanks, and a self-addressed stamped envelope for their next donation. In 2019, ALSAC mailed approximately 328 million mail pieces to raise donations which fund 75% of St. Jude’s operations. ALSAC processed and mailed 900+ Marketing Mail pieces that included the U.S. Postal Service Informed Delivery campaign, to elevate awareness and drum up donations from future humanitarians, increasing response rate by 35%, paving the way for higher donor participation and funding.
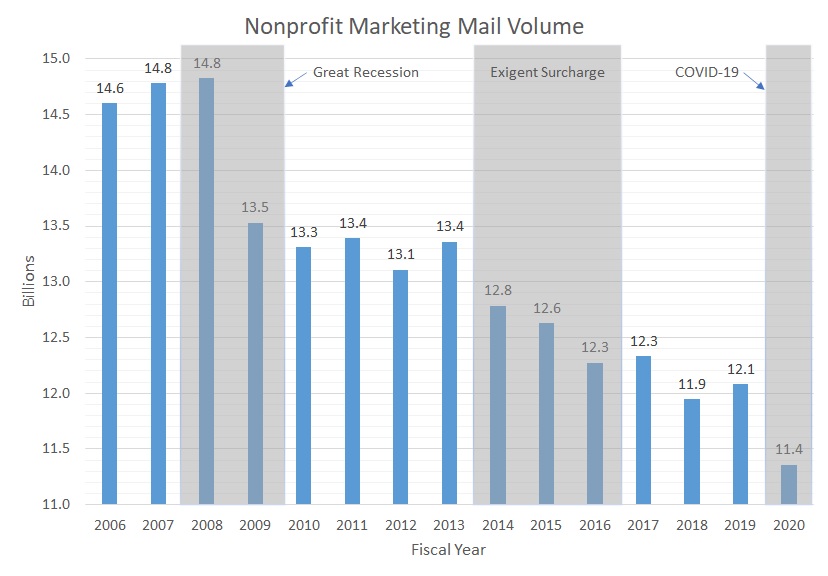
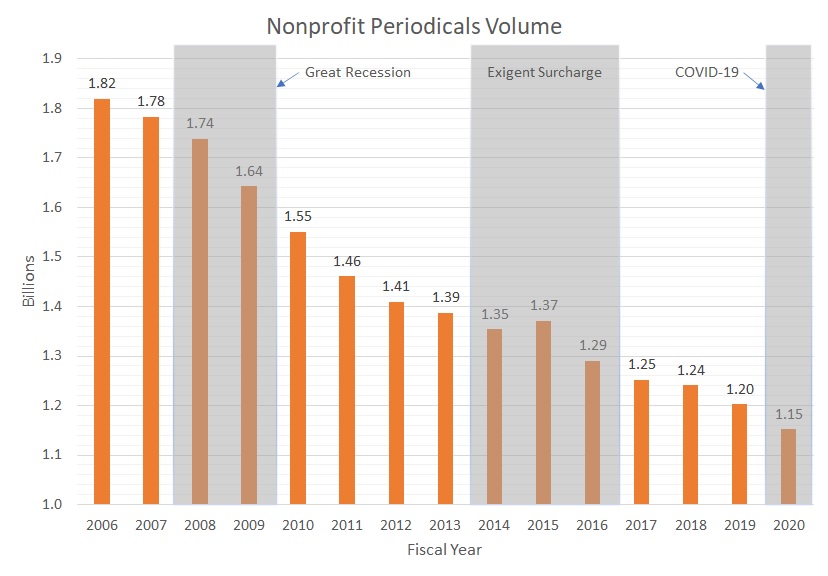
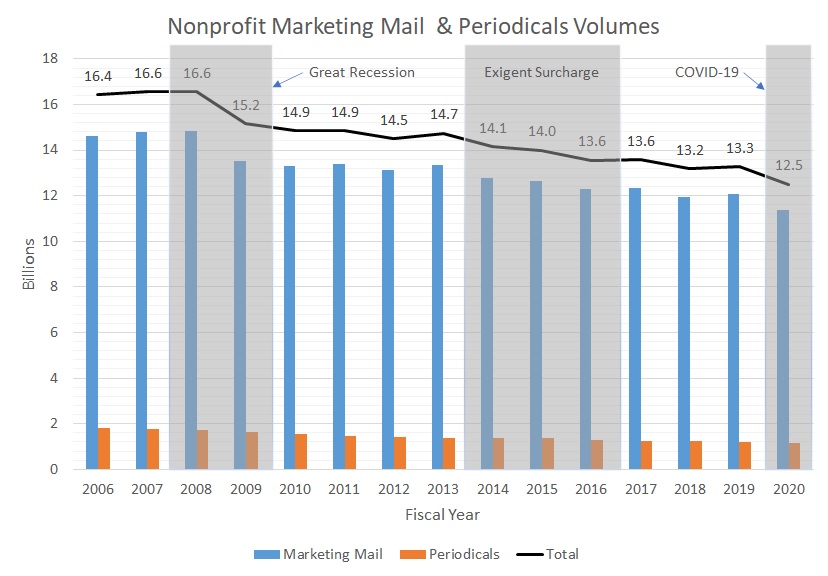
Nonprofit mail volumes were growing before the great recession, and held steady between the three events, but dropped quite a bit during them. The great recession lasted from December 2007 to June 2009. The exigent surcharge was in effect from January 26, 2014 to April 10, 2016. COVID-19 affected USPS mail for approximately 7 months of Fiscal year 2020, and of course continues.
The following graphs and table show the impact of the three events on nonprofit Marketing Mail and Periodicals fiscal year mail volumes. Nonprofit mailers were affected not only by the actual events, but also by the uncertainty about when they would end. The Postal Service tried very hard to get the PRC to make the exigent surcharge permanent, and the regulator announced its end-point on February 26, 2016, about six weeks before it was rolled back.
It is hard to understand how anyone looking at the data would think major rate increases are the solution for what ails USPS finances. The only rational reason to do this would be to milk the captive cash cow in preparation for shutdown or re-prioritization to a government-run e-commerce package delivery service.
Nonprofit Mail Volumes by Fiscal Years (October-September)
Great Recession
NP Marketing Mail NP Periodicals NP MM & Per Total
2008 14.83 billion 1.74 billion 16.57 billion
2010 13.31 billion 1.55 billion 14.86 billion
-1.52 billion -0.19 billion -1.71 billion
-10.3 % -10.9 % -10.3 %
Exigent Surcharge
NP Marketing Mail NP Periodicals NP MM & Per Total
2013 13.36 billion 1.39 billion 14.75 billion
2017 12.33 billion 1.25 billion 13.58 billion
-1.03 billion -0.14 billion -1.17 billion
-7.7 % -10.1 % -7.9 %
COVID-19
NP Marketing Mail NP Periodicals NP MM & Per Total
2019 12.08 billion 1.20 billion 13.28 billion
2020 11.36 billion 1.15 billion 12.51 billion
-0.72 billion -0.05 billion -0.77 billion
-5.9 % -4.2 % -5.8 %
2008-2020
NP Marketing Mail NP Periodicals NP MM & Per Total
2008 14.83 billion 1.74 billion 16.57 billion
2020 11.36 billion 1.15 billion 12.51 billion
-3.47 billion -0.59 billion -4.06 billion
-23.4 % -33.9 % -24.5 %


Leave a Reply